NASA JPL / DROUGHT INDICATORS
DESIGNING WATER APPLICATIONS
How principles of industrial design can improve NASA data products.

Originated at MIT Media Lab hosted 2026 AI Hackathon 'HARD MODE'
Invited by Anthropic to present at Code with Claude Conference

02 / PREMISE
CUSTOMERS DON’T BUY SPECS.
We choose products, services, and technology for what they make possible — a chair, a shoe, a phone, a car — each good built through a process that turns a stated need into a considered, tested, manufactured object.

As part of optimizing how these products get made, designers and
strategists translate customer needs into requirements long before a
single unit ships. A running shoe, for instance, isn't "a shoe" — it's a
resolved list of trade-offs:
REFLECTIVITY
BREATHABILITY
WIDTH
ARCH SUPPORT
COLOR OPTIONS
LIGHTER CUSHIONING

03 / TENSION
DESIGN THINKING IS A DISCIPLINE, NOT A MOOD BOARD.
Design translates an ambiguous problem through research, empathy, definition, ideation, prototype, test, and refinement — working alongside engineering and science rather than competing with them.

03 / DATA TOOLS ARE PRODUCTS
A TOOL IS A PRODUCT WHEN SOMEONE DEPENDS ON IT
TO DO SOMETHING.
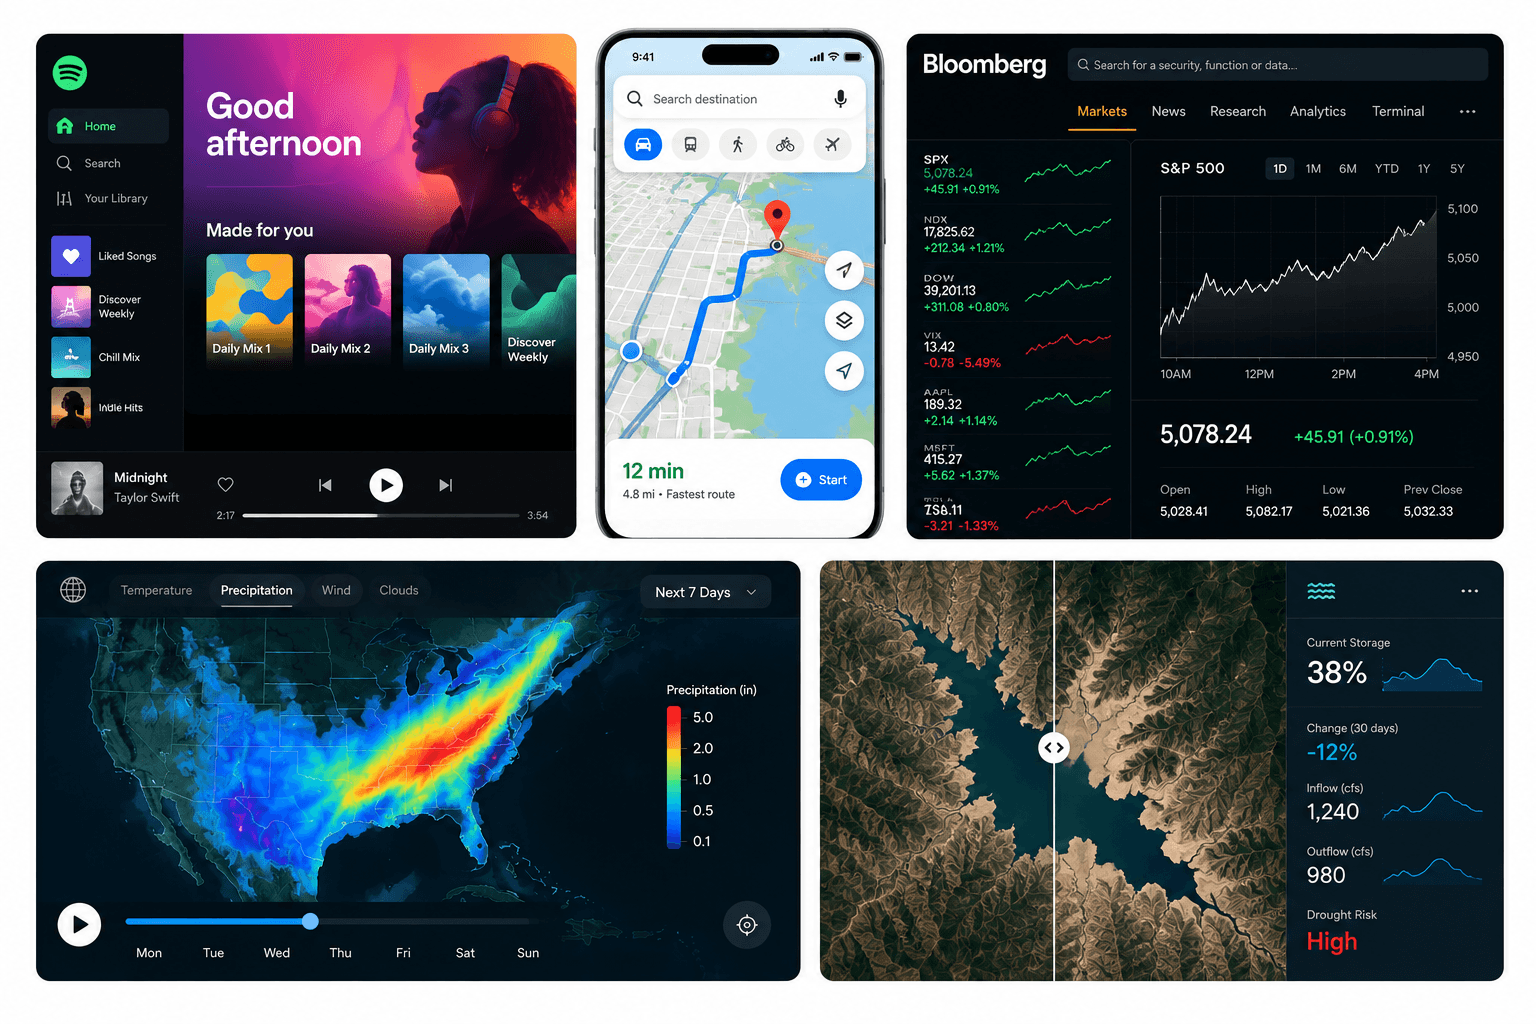
A product does not have to be physical. A map, dashboard, forecast, or drought indicator is also a designed object — one with users, requirements, interactions, decisions, and consequences.
If someone depends on information to allocate water, plan a crop, prepare for drought, or manage a reservoir, the way that information is delivered is part of the product.

04 / THE PROBLEM
DROUGHT ISN’T ONE NUMBER.
Unlike a song, route, or stock price, drought has no single signal. Drought is understood through overlapping indicators—precipitation, snowpack, soil moisture, vegetation, reservoirs, groundwater, and forecasts. Each describes a different part of the system, at a different scale and over a different timeframe.

05 / context
WHEN CONDITIONS arE LESS PREDICTABLE, INFORMATION
HAS TO BE MORE USEFUL.
We are asking people to make higher stakes decisions in a more variable system. Drought, heat, flood, changing snowpack, and increasingly variable water availability place greater pressure on the people responsible for land, agriculture, reservoirs, and communities.
Their challenge is not simply having more data. It is knowing what conditions mean, what may happen next, and what action to take.
Map: Yearly snapshot of the Drought Severity & Coverage Index for every state.
Chart: Weekly time series for the West region
Source:
U.S. Drought Monitor (droughtmonitor.unl.edu) ·
National Drought Mitigation Center, USDA, NOAA — Data via usdmdataservices.unl.edu

05 / why
ANNE STEINEMANN, DROUGHT INFORMATION FOR IMPROVING PREPAREDNESS IN THE WESTERN STATES, 2014
06 / QUESTION
WHAT IF DROUGHT DATA WERE DESIGNED LIKE A PRODUCT?
Turn that same lens on data. Dozens of drought indicators already exist —
precipitation percentiles, soil moisture anomalies, evapotranspiration
deficits, vegetation indices — each one a real, rigorous measurement of
the water cycle.

Available drought data products are traditionally designed by scientists for other scientists.
07 / DATA JOURNEY
FROM USABLE TO USEFUL
How stakeholders experience a data product determines whether they can use it at all — which in turn determines the size of its real-world impact. Design's opening is to move indicators from merely usable togenuinely useful: built around the action, the decision, the goal, not
just the reading.


08 / DATA JOURNEY
FROM EARTH OBSERVATIONS TO HUMAN DECISIONS
How raw data becomes meaningful information through a transparent pipeline.

09 / PROJECT CONTEXT
NASA JPL. REAL PEOPLE. REAL DECISIONS.
This research was funded through an interdisciplinary climate-adaptation program, contributing to the National Climate Assessment and connecting drought science to the people who use it.


The goal: use the methods of product design to make drought science more operational, connect science to the decisions people make with it, and treat water managers, farmers, and agencies for what they are — the customers of a data product.
10 / solve for one, extend to many
START WITH THE
EXTREME USER.
Designing for a wider range of people makes a better product for everyone. Extreme users' needs are amplified, and their workarounds are more visible — pulling out real needs that the mainstream middle of the bell curve never surfaces on its own. We start with people operating at the edge of water scarcity— where decisions are hardest and information gaps are highest. Their needs reveal the decision moments generic tools often miss.



EXTREME USERS → EXTREME DROUGHT CONDITIONS → U.S. DROUGHT MAP → SELECTED STATES → FIELD RESEARCH
11 / TRANSLATING THE METHOD
TO WATER SYSTEMS.
We ran the same extreme-user logic on the water system itself: starting with the whole U.S., narrowing to drought-affected states, and following managers through a full agricultural water year.


12 / IN THE FIELD
LEARNING WHERE WATER MATTERS MOST.
Field research across snowfields, farms, reservoirs, and communities.
SEE FIELD NOTES →

AGRICULTURAL COMMUNITIES
Central valley
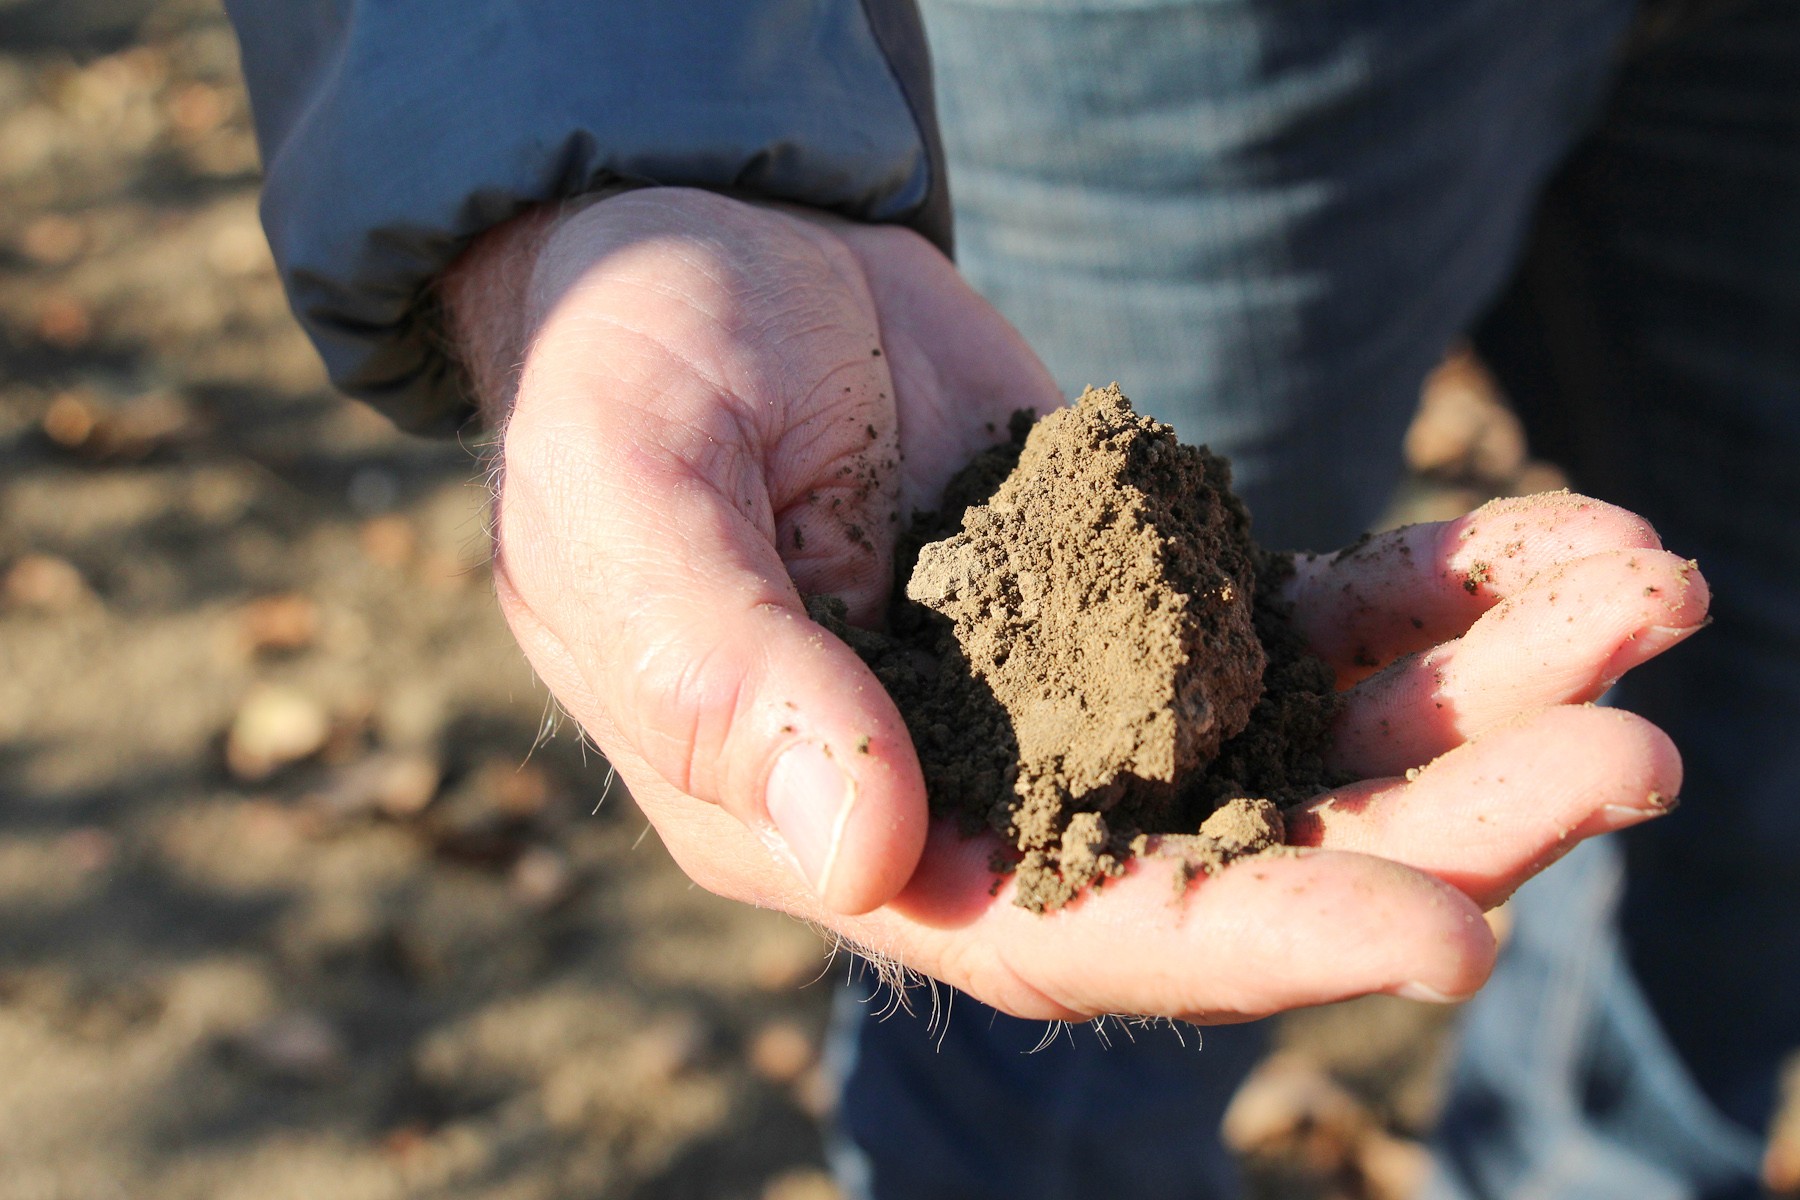
grower in
Central Valley, CA

Water manager,
Central valley

Fresno county, CA water manager
13 / DESIGNING FOR THE EXTREME USER
WE START AT THE EDGE OF THE PROBLEM.
The extreme user lives at the edge of water scarcity. Their decisions are high-stakes, their context is complex, and generic tools often fail them.
By listening deeply, we uncover the real needs that shape a meaningful solution for everyone.
SEE THEIR STORIES →


“We don't need more data, we need to know what to do with it”
— Water Manager, Central Valley, CA


06 / RESEARCH FRAMEWORK
SIX STAGES, ONE DROUGHT SEASON.
I. FOUNDATIONAL RESEARCH

II. PRELIMINARY RESEARCH
III. INTERVIEWS & FIELD RESEARCH
IV. CONTEXTUAL DATA JOURNEYS

V. ANALYSIS & SYNTHESIS

VI. TESTING & REFINEMENT


THIS IS NOT A MAP.
THIS IS A DECISION TOOL.
A drought indicator is not an end in itself. It is a bridge between science and action — built around the decision, and the person making it.
published in the Bulletin of the American Meteorological Society (BAMS) Available online and in print.
